District Information
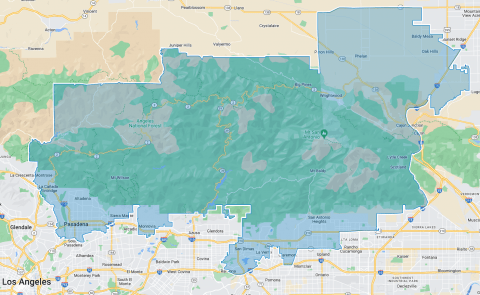
DISTRICT AD41
2020 Census Population (adj Elec. §21003)
| Name | Count | Percent |
|---|
| Total Population (POP) | 485,018 | 100.00% |
|---|
| POP Hispanic or Latino | 152,668 | 31.48% |
|---|
| POP Not Hispanic or Latino (NH) | 332,350 | 68.52% |
|---|
| POP NH Population of one race | 310,918 | 64.10% |
|---|
| POP NH White alone | 210,091 | 43.32% |
|---|
| POP NH Black or African American alone | 29,041 | 5.99% |
|---|
| POP NH Asian alone | 67,201 | 13.86% |
|---|
| POP NH American Indian and Alaska Native alone | 1,096 | 0.23% |
|---|
| POP NH Native Hawaiian and Other Pacific Islander alone | 507 | 0.10% |
|---|
| POP NH Some Other Race alone | 2,982 | 0.61% |
|---|
| POP NH Population of two or more races | 21,432 | 4.42% |
|---|
2020 Census Housing Occupancy Status
| Name | Count | Percent |
|---|
| Total Housing Units | 190,407 | 100.00% |
|---|
| Occupied | 180,349 | 94.72% |
|---|
| Vacant | 10,058 | 5.28% |
|---|
2020 Census Group Quarters Population (adj Elec. §21003)
| Name | Count | Percent |
|---|
| Total Group Quarters Population: | 11,747 | 100.00% |
|---|
| Institutionalized population: | 2,312 | 19.68% |
|---|
| Correctional facilities for adults | 0 | 0.00% |
|---|
| Juvenile facilities | 433 | 3.69% |
|---|
| Nursing facilities/Skilled-nursing facilities | 1,858 | 15.82% |
|---|
| Other institutional facilities | 21 | 0.18% |
|---|
| Noninstitutionalized population: | 9,435 | 80.32% |
|---|
| College/University student housing | 6,274 | 53.41% |
|---|
| Military quarters | 0 | 0.00% |
|---|
| Other noninstitutional facilities | 3,161 | 26.91% |
|---|
Counties In District
| Name | Count | Percent |
|---|
| Los Angeles | 363,676 | 3.62% |
|---|
| San Bernardino | 121,346 | 5.57% |
|---|
Places In District
| Name | Count | Percent |
|---|
| LOS ANGELES: Altadena(U) | 43,015 | 100.00% |
|---|
| LOS ANGELES: Bradbury(C) | 925 | 100.00% |
|---|
| LOS ANGELES: Claremont(C) | 37,412 | 100.00% |
|---|
| LOS ANGELES: Duarte(C) | 0 | 0.00% |
|---|
| LOS ANGELES: La Canada Flintridge(C) | 20,602 | 100.00% |
|---|
| LOS ANGELES: La Verne(C) | 31,425 | 100.00% |
|---|
| LOS ANGELES: Monrovia(C) | 37,763 | 99.25% |
|---|
| LOS ANGELES: Pasadena(C) | 139,255 | 100.00% |
|---|
| LOS ANGELES: San Dimas(C) | 35,020 | 100.00% |
|---|
| LOS ANGELES: San Pasqual(U) | 2,107 | 100.00% |
|---|
| LOS ANGELES: Sierra Madre(C) | 11,302 | 100.00% |
|---|
| LOS ANGELES: Remainder of Los Angeles(R) | 4,850 | 5.53% |
|---|
| SAN BERNARDINO: Hesperia(C) | 1,173 | 1.17% |
|---|
| SAN BERNARDINO: Lytle Creek(U) | 725 | 100.00% |
|---|
| SAN BERNARDINO: Oak Hills(U) | 9,470 | 100.00% |
|---|
| SAN BERNARDINO: Phelan(U) | 13,904 | 100.00% |
|---|
| SAN BERNARDINO: Pinon Hills(U) | 7,278 | 100.00% |
|---|
| SAN BERNARDINO: Rancho Cucamonga(C) | 36,694 | 20.99% |
|---|
| SAN BERNARDINO: San Antonio Heights(U) | 3,454 | 100.00% |
|---|
| SAN BERNARDINO: Upland(C) | 40,399 | 50.90% |
|---|
| SAN BERNARDINO: Wrightwood(U) | 4,727 | 100.00% |
|---|
| SAN BERNARDINO: Remainder of San Bernardino(R) | 3,522 | 2.90% |
|---|
